


Copy/Paste the following code to your GroIMP project:
//**********************************************************
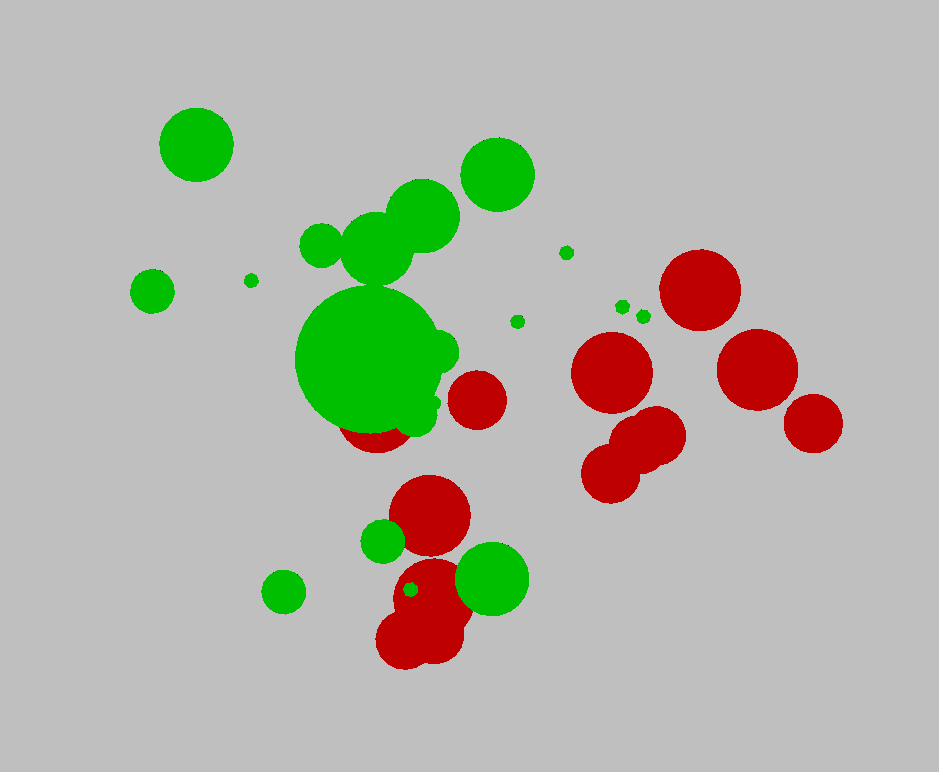
/* Plant dispersal model (2 species), circular plants.
You will learn:
– the extension of the previous example to two different species
with differing parameters for dispersal and growth,
– how several variables can be plotted in the same chart.
*/
module Plant(int t, int s, super.radius) extends Cylinder(2-s, radius)
{{ /* s = number of the species, 0 = green plant, 1 = red plant */
if (s == 0)
setColor(0x00aa00);
else
setColor(0xaa0000);
}};
double[] pgrow = {0.9, 0.9}; /* radius increment for each species */
double[] seed_rad = {0.1, 0.1}; /* initial radius */
int[] pmaxage = {30, 15}; /* maximal age */
int[] pgenage = {12, 8}; /* minimal age for reproduction */
int[] pgenint = {4, 3}; /* time interval for reproduction */
double[] distmin = {15, 15}; /* minimal distance for seed dispersal */
double[] distmax = {70, 70}; /* maximal distance for seed dispersal */
double[] pminrad = {9, 8}; /* minimal radius for reproduction */
double[] pgenfac = {0.5, 0.7}; /* ratio (number of seeds):radius */
int n = 0; /* counter for time steps */
const DatasetRef population_size = new DatasetRef(“population size”);
/* dataset for chart */
protected void init()
{
population_size.clear().setColumnKey(2,”plant_sp1″).setColumnKey(0,”plant_sp2″);
/* preparation of two columns in the table.
Default colours in the plot: 0 = red, 1 = blue,
2 = green */
chart(population_size, XY_PLOT);
[
Axiom ==> [ Plant(0, 0, seed_rad[0]) ]
RU(90) M(50) RU(-90) Plant(0, 1, seed_rad[1]);
]
}
public void make()
{
[
Plant(t, s, r), (t > pmaxage[s]) ==> ; /* death because of high age */
Plant(t, s, r), (t >= pgenage[s] && ((t – pgenage[s]) % pgenint[s] == 0)
&& r >= pminrad[s])
==> for ((1 : (int) (pgenfac[s]*r)))
( [ RH(random(0, 360)) RU(90) M(random(distmin[s], distmax[s]))
RU(-90) Plant(0, s, seed_rad[s]) ] ) /* seed dispersal */
Plant(t+1, s, r);
Plant(t, s, r) ==> Plant(t+1, s, r+pgrow[s]); /* vegetative growth */
]
n++;
population_size.addRow().set(2, count((* p:Plant, (p[s] == 0) *))).set(0,
count((* p:Plant, (p[s] == 1) *)));
println(n);
}
//**********************************************************